
Product is one of the 4Ps of the Marketing mix.
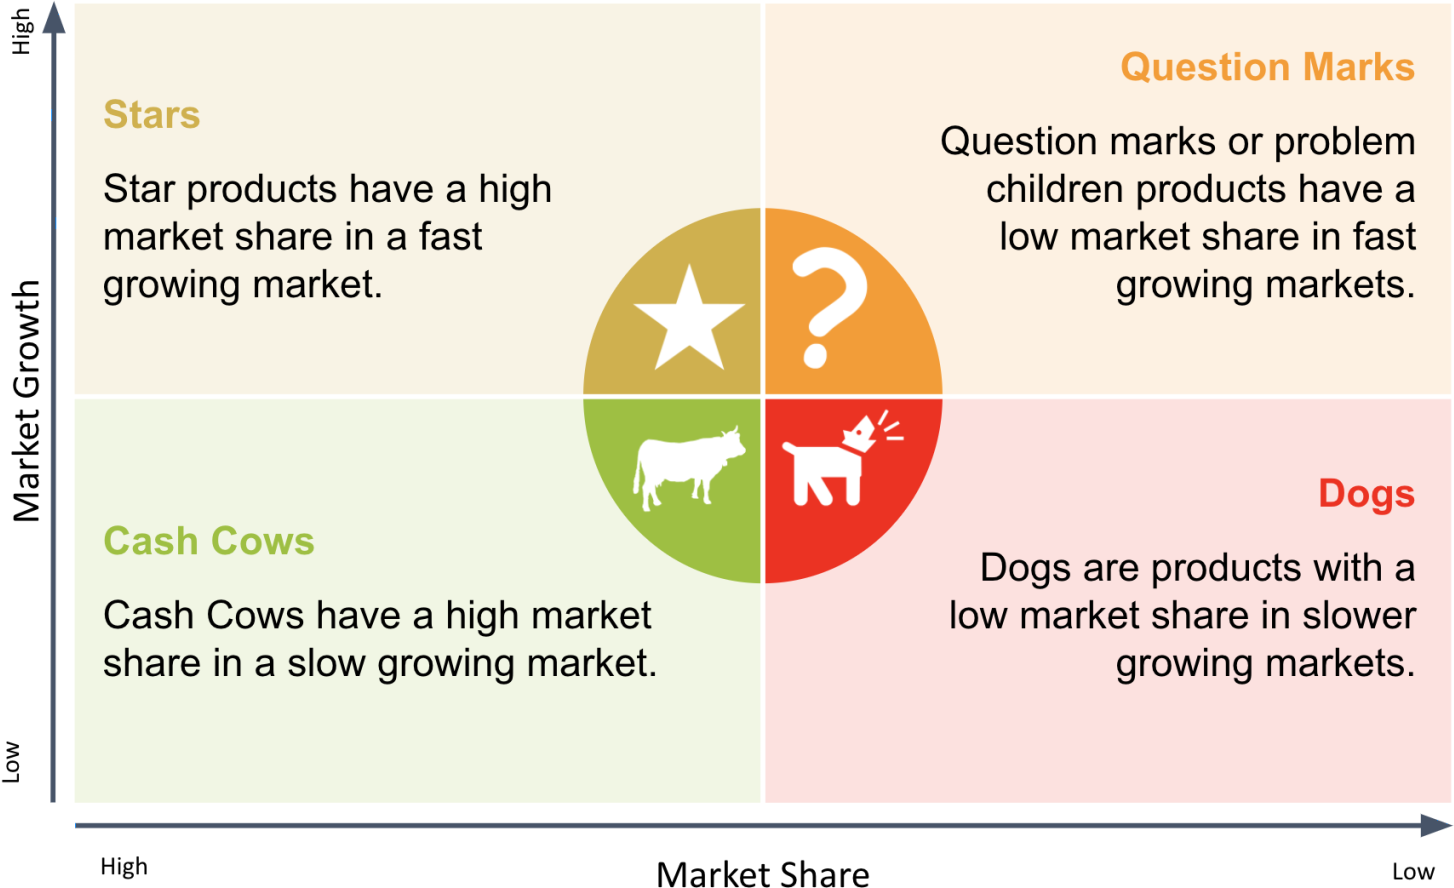
The Boston Matrix allows a business to measure its products against its competition using market share and potential market growth.

Market Share is the percentage of sales owned by a particular company in a particular product area or market. For example, Apple’s iPhone has a market share of 24.82% in the smartphone market (source).
Market Growth is an increase in size or an increase in sales within a given consumer group (market) over a specified time frame.
The matrix refers to products as question marks/ problem children, stars, Cash cows and dogs.
The business can then look at its Product portfolio and compare this to its competitors to make decisions about the future of its products, for example investing more in advertising or even discontinuing the products.
Companies will Aim to launch products that have high growth potential (question marks), successful products will move to stars, then cash cow and hen dogs to eventually be liquidated.
A business’s products will move around the Boston Matrix. For example:
Successful Products will move from Question Marks > Stars > Cash Cows > Dogs.
Unsuccessful Products Question Marks > Stars > Dogs or straight to dogs and miss the profitable cash cow stage.
- Question marks/ problem children – the business will be looking at these products closely to decide their future. Old products with falling sales are likely to be discontinued, however, the business might decide to invest in new products that have a low market share to try to stimulate sales.
- Stars – these products have a high market share but may require extra investment in advertising to help increase sales and prevent competitors from capturing the growing market
- Cash cows – high market share but growth has steadied, businesses will be looking to get as much profit from these as possible and to “milk their cash cows”
- Dogs – low market share and low market growth. Businesses will often look to remove these products unless they help drive sales of another more successful product
Businesses that have a varied product range are likely to be successful as they generate revenue from various sources, this also allows them to use the profits from the cash cows or stars to invest in question marks.
Apple Example
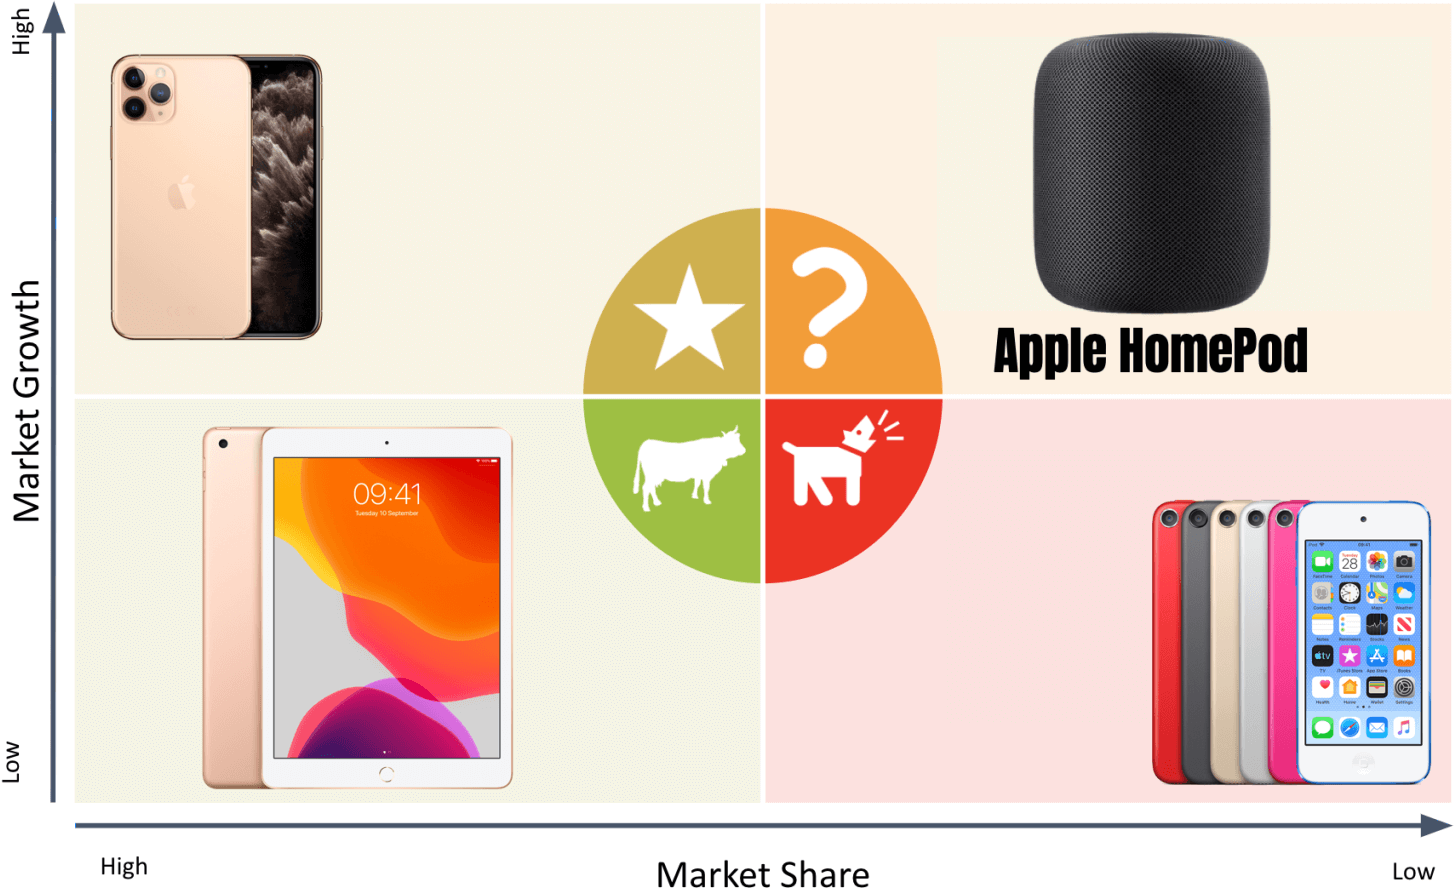
Think of it like a graph, products can be placed towards the top of each quadrant to show high growth or further left to show higher sales.
Samsung Example

Remember for the exam:
Uses of the Boston Matrix:
- Product classification according to market share and rate of growth of the market – The Boston Matrix acts as a visual representation of a product’s market share and the growth of a market.
- Aid decision-making with regards to the product portfolio – businesses with many products will need to consider that not every product may be successful and will need to make decisions around whether to invest resources in unsuccessful products or whether to discontinue and invest in the development of products with a greater market growth potential.
- Product withdrawal – The Boston Matrix can help a business understand when a product is no longer viable. Dog products are most likely to be discontinued as they have a low market share and the market is growing, meaning that it will be increasingly hard to capture customers from competitors as there are likely to be fewer new customers entering the market.
- Product development – The Boston Matrix can be used to help a business identify areas to focus resources on developing new products. This can help the business prevent wasting resources on developing products that are unlikely to be successful.
Exam Question
Using the Samsung Boston Matrix, evaluate whether Samsung should discontinue its Smartwatch product. [6 marks]

